


Who’s Ahead in the U.S. Presidential Race: Donald Trump or Kamala Harris?
-
“Trump vs. Harris: Who Will Claim the U.S. Presidency?”
-
“The Race for the White House: Trump and Harris Go Head-to-Head”
-
“November Showdown: Donald Trump or Kamala Harris for President?”
-
“Presidential Race 2024: Polls and Predictions for Trump and Harris”
-
“Election 2024: The Battle Between Trump and Harris Heats Up”
American voters will cast their ballots in the presidential election on November 5, 2024, to choose the next president of the United States.
- “Trump vs. Harris: Who Will Claim the U.S. Presidency?”
- “The Race for the White House: Trump and Harris Go Head-to-Head”
- “November Showdown: Donald Trump or Kamala Harris for President?”
- “Presidential Race 2024: Polls and Predictions for Trump and Harris”
- “Election 2024: The Battle Between Trump and Harris Heats Up”
Initially, this election appeared to be a rematch of the 2020 presidential election. However, the situation took a turn in July when President Joe Biden announced his withdrawal from the race and endorsed Vice President Kamala Harris.
Now, the big question is whether this election will result in Donald Trump becoming president for a second time or if a woman will make history as the first female president of the United States.
As Election Day approaches, we are monitoring polls and assessing the impact of the campaigns on the race for the White House.
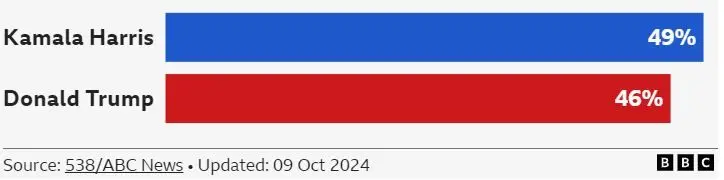
National Polling Trends:
On the day President Biden announced his withdrawal from the race, all public opinion polls showed Donald Trump leading. Subsequent polls indicated that Kamala Harris’s entry into the race would not significantly improve the results.
However, after Kamala Harris launched her campaign, the presidential race tightened, and she gained a slight lead over her opponent in national polls, which she has managed to maintain.
Below are the approval ratings for both candidates based on polls conducted across the United States up to the end of September.
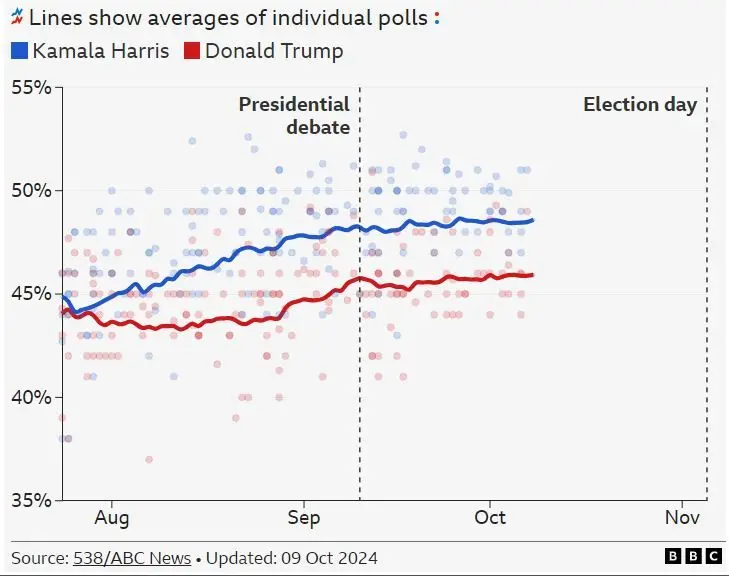
Election Overview:
On September 10, Kamala Harris and Donald Trump faced off in a presidential debate watched by 67 million viewers.
In national polls conducted that week, Kamala Harris showed a slight lead over her rival, with her margin increasing from 2.5% to 3.3%. However, this shift resulted more from a decline in Trump’s popularity than an increase in Harris’s.
The chart below illustrates how the candidates’ approval ratings have changed since Harris joined the presidential race.
Approval Ratings Chart:
While these polls indicate which presidential candidate is more popular nationwide, they do not accurately predict election outcomes.
This is due to the electoral college system in the United States, where each state is allocated votes based on its population. There are a total of 538 electoral votes, and any candidate needs 270 votes to win.
The U.S. has 50 states, but since most of them consistently vote for one party, there are only a few states where presidential candidates hope for an upset. These states, known as “battleground” states, determine the fate of candidates aspiring to become president. In which states are the candidates currently leading?
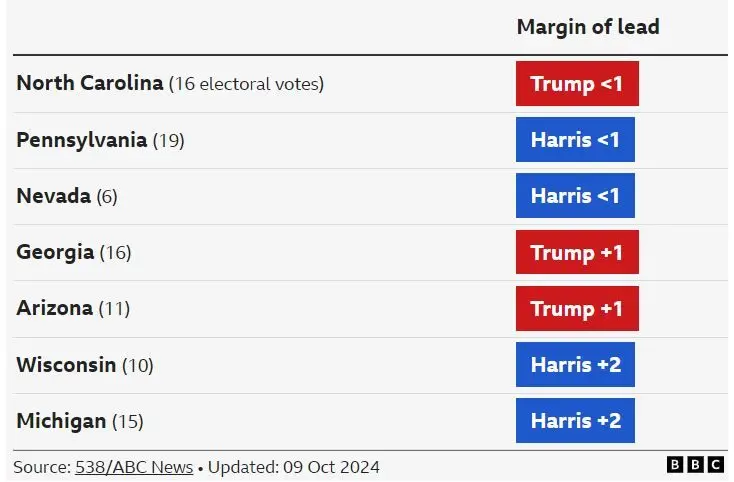
Battleground State Dynamics:
There are seven states in the U.S. where close contests are expected, and the results from polls in these states are quite competitive. This makes it difficult to ascertain who is ahead, as there is limited data compared to national polls. Each poll carries a margin of error, which means the numbers could be higher or lower.
Recent surveys indicate that in several of these states, the popularity difference between the candidates is minimal (meaning there’s no clear leader). Pennsylvania is particularly crucial, as it has the highest number of electoral votes, making it easier to reach the 270 votes needed for victory.
Current Standings in Battleground States:
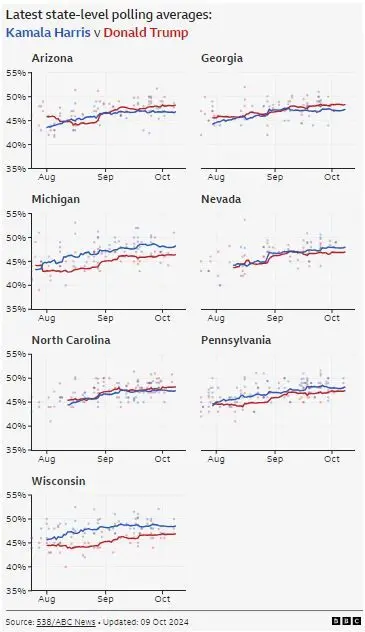
Pennsylvania, Michigan, and Wisconsin have traditionally been strongholds for the Democratic Party, but Trump turned them red in 2016. Biden regained them in 2020.
According to the chart below, Kamala Harris has a slight lead in all three states since August, though the margins are very close. If she can retain these states this year, her chances of winning will increase.
Since Harris became the Democratic nominee, the race has shifted, evident from the fact that on the day Biden withdrew from the presidential race, she was approximately five average points behind Trump in those seven states.
How Are Averages Calculated?
The data presented in the graphics above is based on averages provided by the polling analysis website 538, which is part of the American news network ABC News. This average is derived from individual polls conducted at the national level and surveys from battleground states.
To maintain quality, only polls from companies meeting certain standards of transparency and sample size are considered. This includes reviewing how the poll was conducted—whether via phone calls, text messages, or online surveys.
Can We Trust These Polls?
Currently, national polls indicate that Kamala Harris and Donald Trump are neck and neck, and when the margin is so small, predicting a winner is very challenging.
In previous elections (2016 and 2020), Trump’s support was underestimated, with him winning one election and losing another. Polling companies are attempting to resolve this issue through various means.
Adjusting for these discrepancies is challenging, and polling firms rely on educated estimates of which individuals will actually vote on November 5.